Procedural content generation: L-Systems

After watching this fantastic interview with Sean Murray about No Man’s Sky I’ve been inspired to write a bit about procedural content generation. I’ve been tinkering with procedural content generation for years, using it for everything from creating games levels to generating sample data for testing and it is a fascinating subject.

So what is procedural content generation?

Wikipedia says “procedural generation is generating content algorithmically rather than manually… The term procedural refers to the process that computes a particular function”. The Procedural Content Generation Wiki suggests it “is the programmatic generation of game content using a random or pseudo-random process that results in an unpredictable range of possible game play spaces… procedural content generation should ensure that from a few parameters, a large number of possible types of content can be generated”.

That’s quite a mouthful! Basically the idea is to get the computer to generate content so you don’t have to :)

Lindenmayer systems

To get the ball rolling I’m going to start with Lindenmayer systems or L-systems. Developed by Hungarian biologist Aristid Lindenmayer in 1968 to describe and model the growth of plants, L-systems can be used to generate amazingly complex structures from a set of very simple rules.

An L-system is represented by a simple string of characters (much like a DNA string) for example “FG+G-F. A very simple system would consist of just a single letter, for example “F”.

It also has bunch of rules. These are simple substitutions that define how each letter in the system should be replaced or expanded.

For example we might have two rules that say “F=G-F-G” and “G=F+G+F”, which basically says replace all F’s with “G-F-G” and replace all G’s with “F+G+F”.

To generate our output we simply iterate a number of times, applying the rules to the result of the previous iteration.

For example if we start with:

  • Start: F
  • Rules:
    • F=G-F-G
    • G=F+G+F

And we iterate once, we get:

G-F-G

If we iterate again (applying the rules again), we get:

F+G+F-G-F-G-F+G+F

And after you iterate 5 times you land up with this enormous string:

G-F-G+F+G+F+G-F-G-F+G+F-G-F-G-F+G+F-G-F-G+F+G+F+G-F-G+F+G+F-G-F-G-F+G+F+G-F-G+F+G+F+G-F-G+F+G+F-G-F-G-F+G+F+G-F-G+F+G+F+G-F-G-F+G+F-G-F-G-F+G+F-G-F-G+F+G+F+G-F-G-F+G+F-G-F-G-F+G+F+G-F-G+F+G+F+G-F-G+F+G+F-G-F-G-F+G+F-G-F-G+F+G+F+G-F-G-F+G+F-G-F-G-F+G+F-G-F-G+F+G+F+G-F-G-F+G+F-G-F-G-F+G+F+G-F-G+F+G+F+G-F-G+F+G+F-G-F-G-F+G+F-G-F-G+F+G+F+G-F-G-F+G+F-G-F-G-F+G+F-G-F-G+F+G+F+G-F-G+F+G+F-G-F-G-F+G+F+G-F-G+F+G+F+G-F-G+F+G+F-G-F-G-F+G+F+G-F-G+F+G+F+G-F-G-F+G+F-G-F-G-F+G+F-G-F-G+F+G+F+G-F-G

Enter the turtle

So great, you now have a very long line of text but it doesn’t seem very useful…

Well imagine a tiny little turtle, this turtle is dragging a pen behind himself and everywhere he walks he leaves a line. He is also a very well trained little turtle and he can follow commands to walk forward or turn left or turn right.

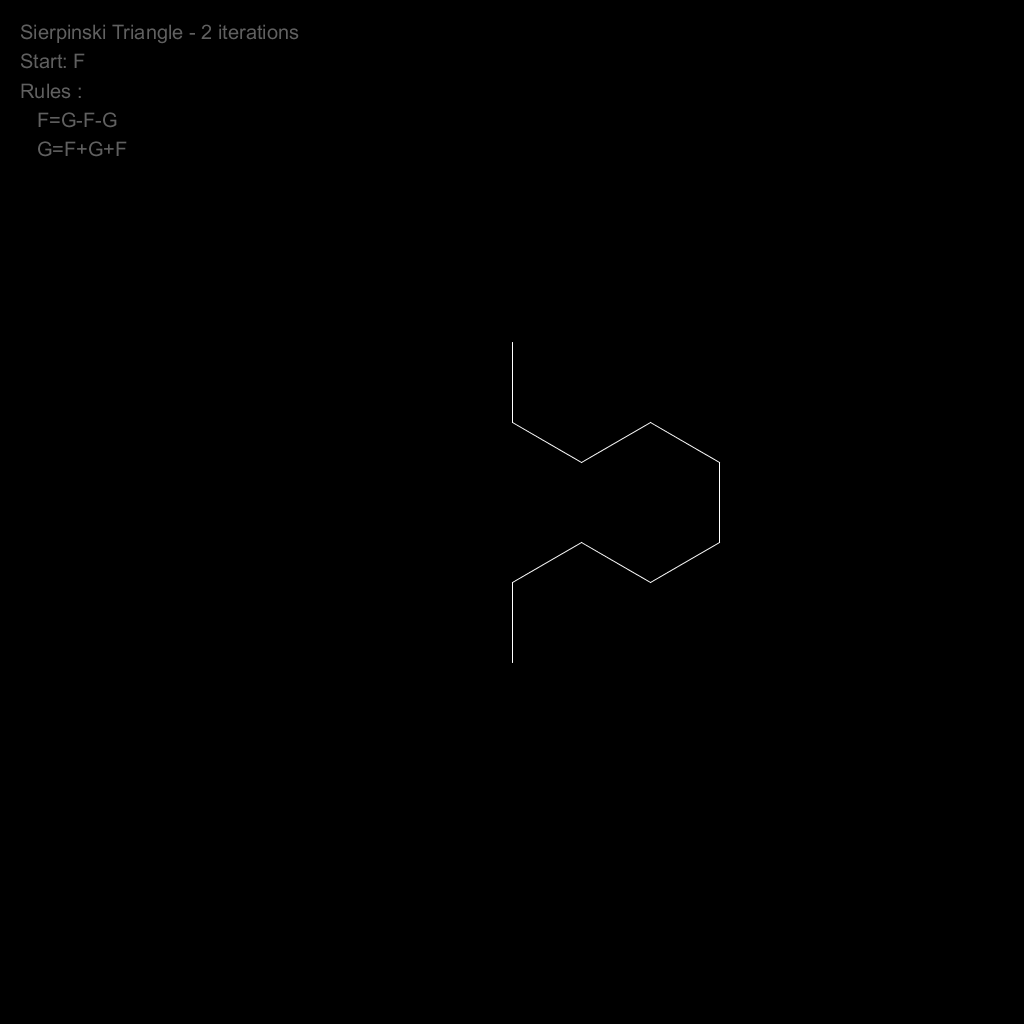
So looking at our string again let’s define that F and G means “go forward 80 steps” and - means “turn left 60 degrees” and + means “turn right 60 degrees”. Then lets turn our generated strings into a list of commands for our wee friend, the turtle.

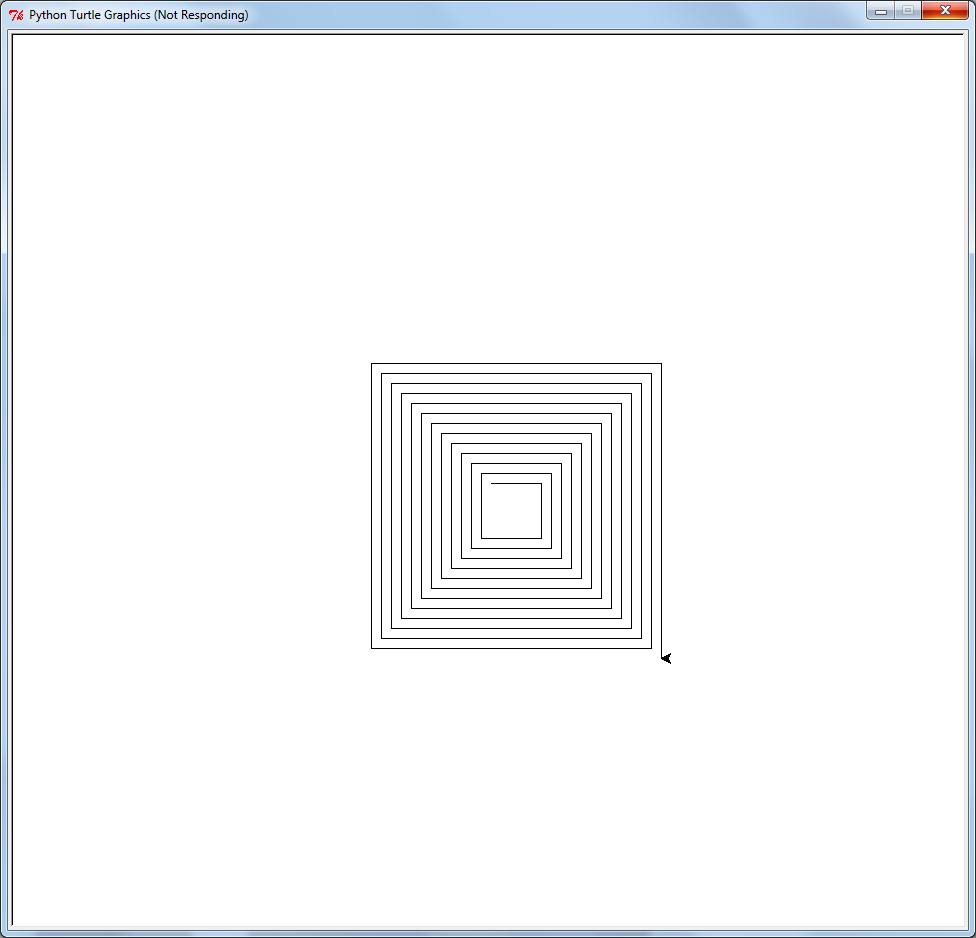
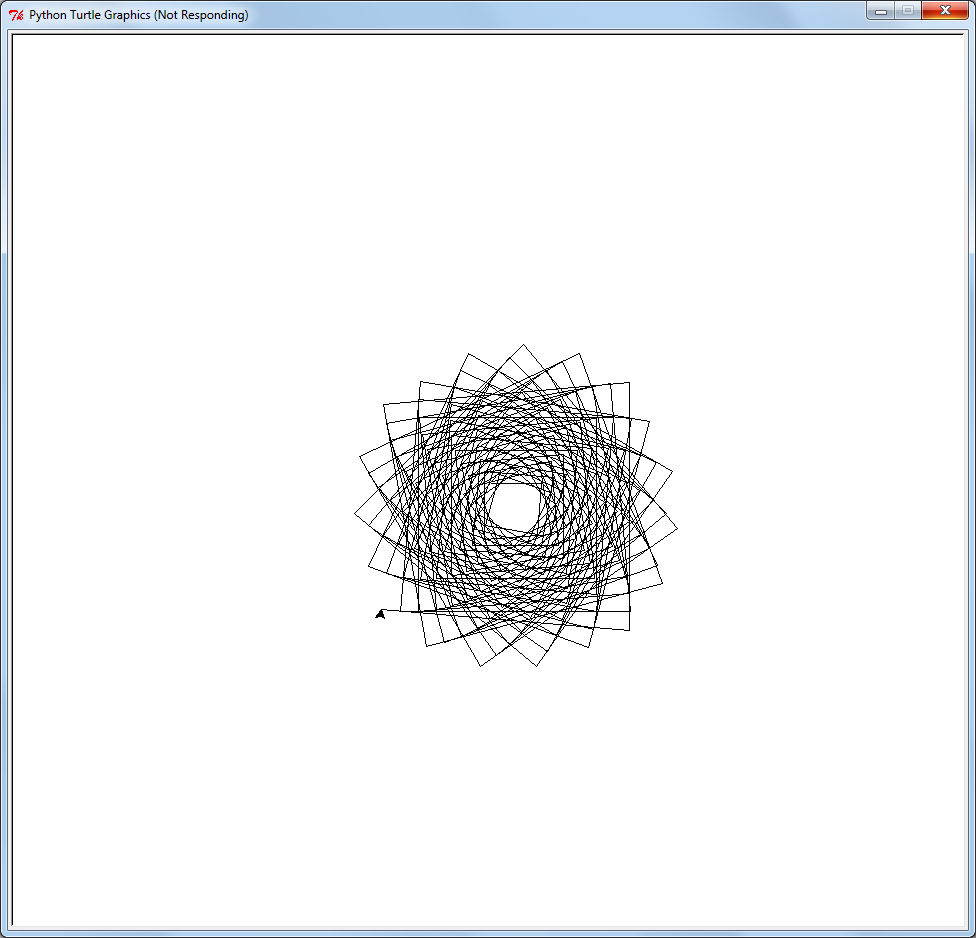
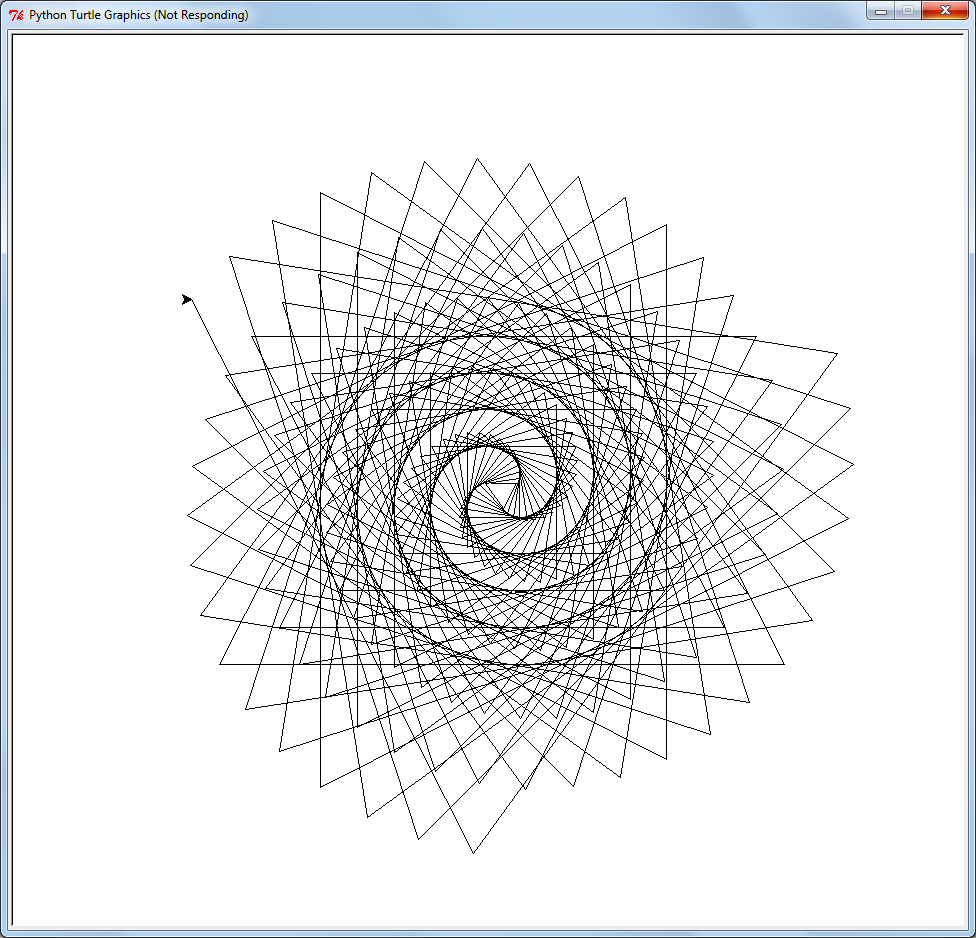
With 2 iterations (and a result of  F+G+F-G-F-G-F+G+F) our turtle will draw the following:

Sierpinski Triangle Example - 2 Iterations

If we keep incrementing our iterations, our turtle will draw:

Sierpinski Triangle Examples

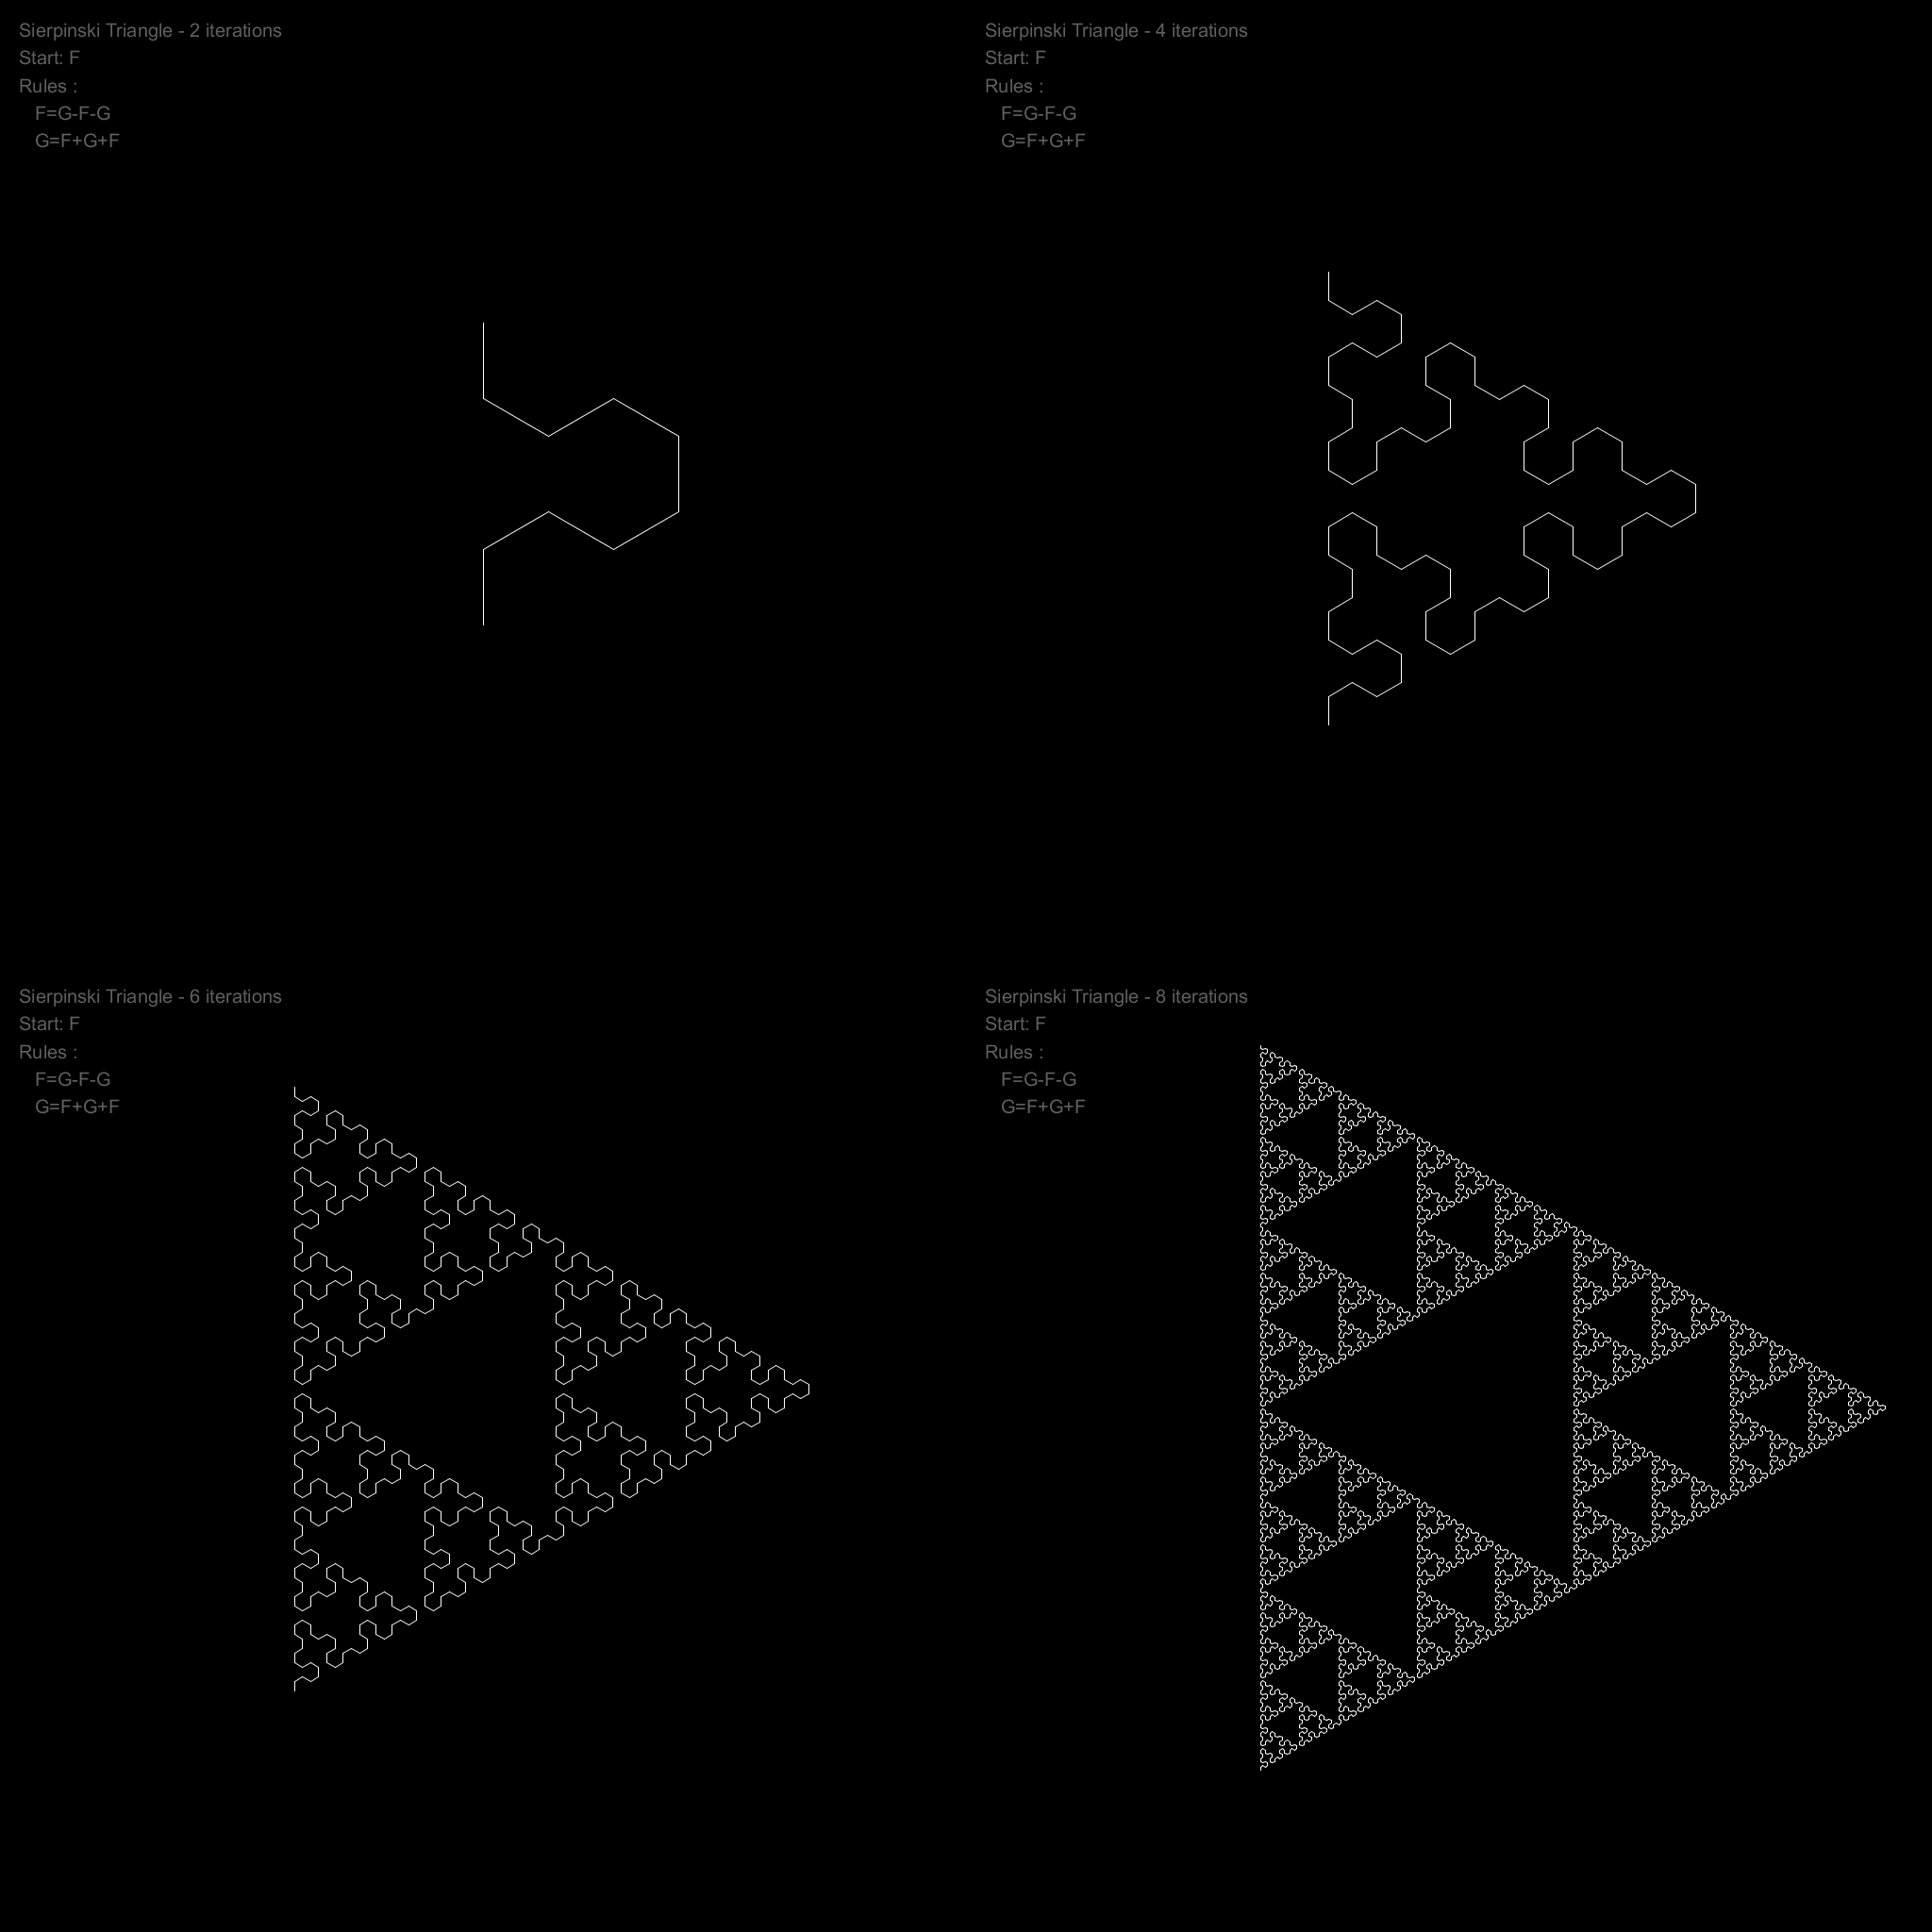
With 8 iterations we end up with quite a cool pattern (known as a Sierpinski Triangle). It could be used as a nice (but predictable) maze for a game or perhaps an interesting texture.

Teleporting Turtle

Let’s teach our turtle some new tricks. Firstly we will teach him to remember his current location and which direction he facing. Next we will teach him to teleport from his current position back to a previous one that he has remembered. We’ll tie these to the [ and ] characters in our L-system strings.

These new commands let us create branching structures, perfect for generating organic things like plants.

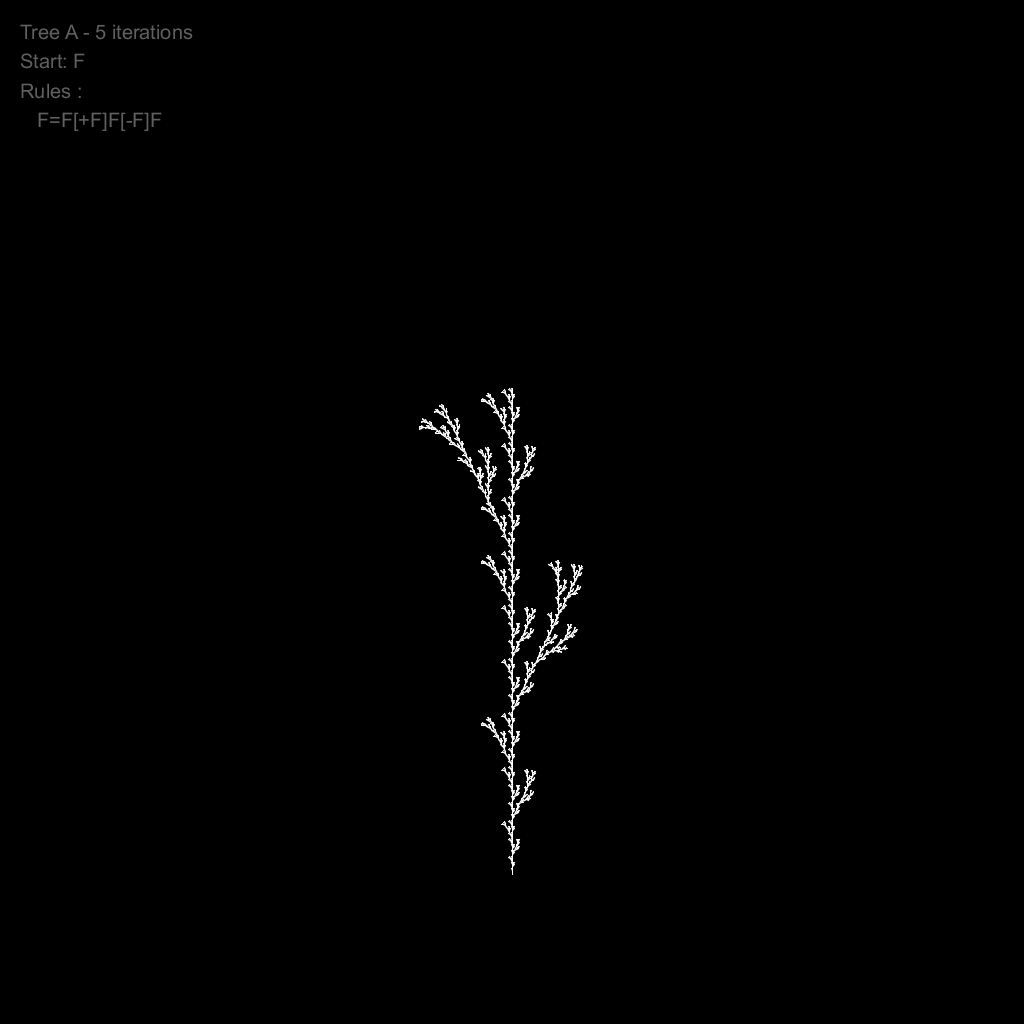
For example with a very simple L-system like this:

  • Start: F
  • Rules:
    • F[+F]F[-F][F]
  • Iterations: 5
  • Angle: 20

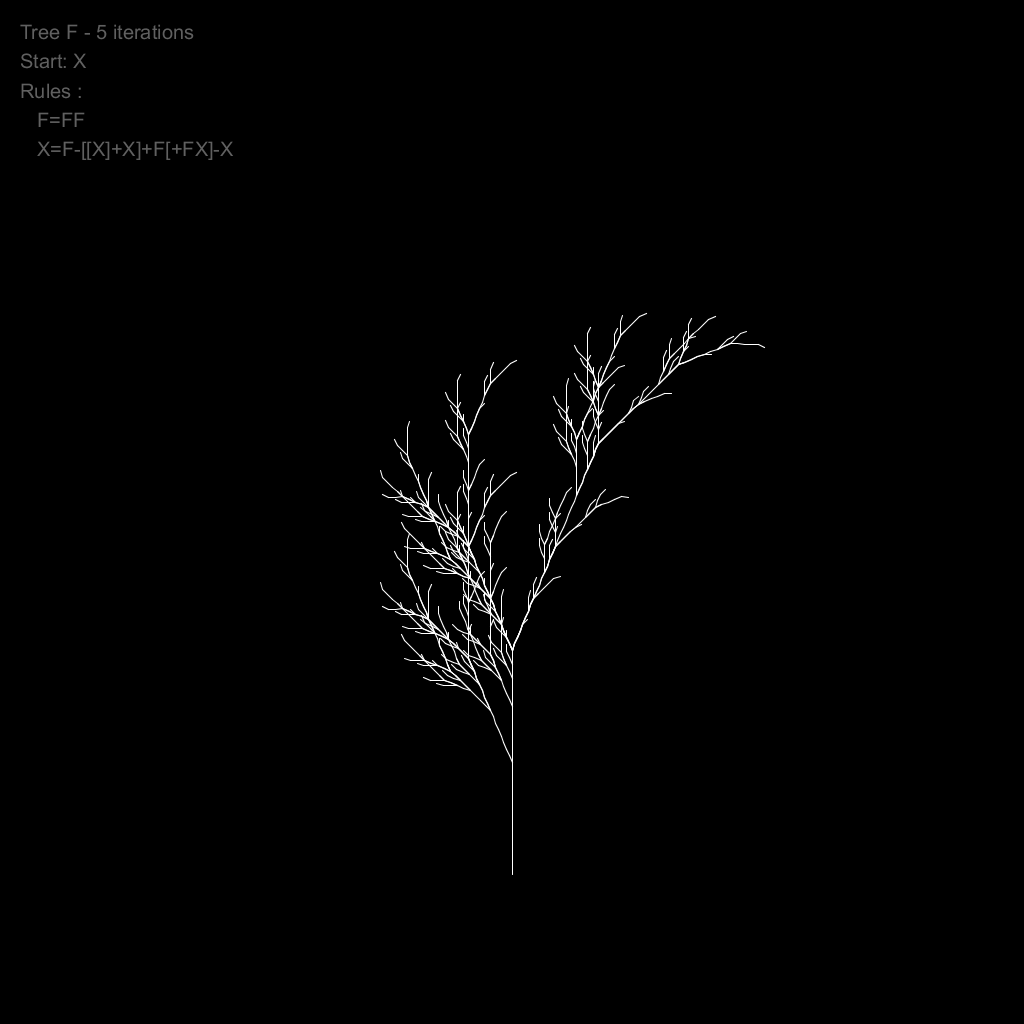
We get this neat plant:

Tree B

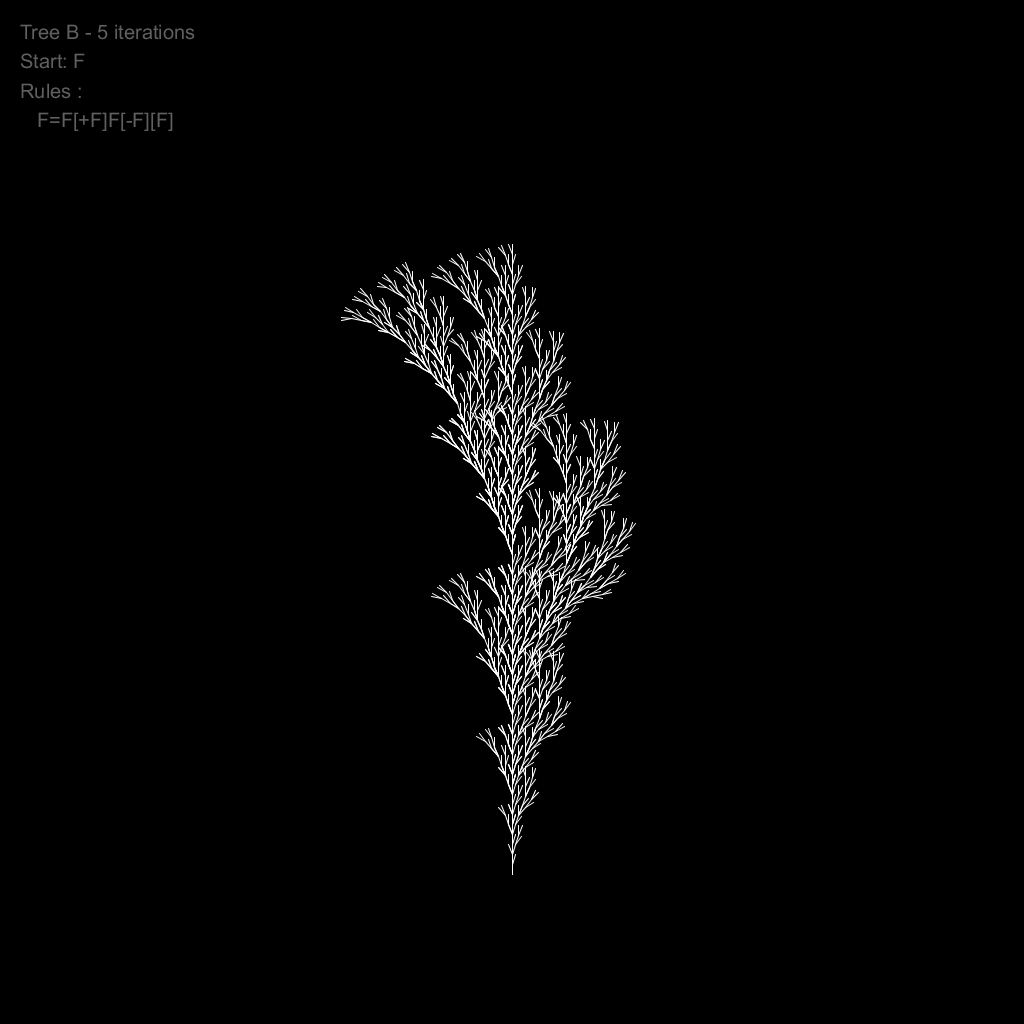
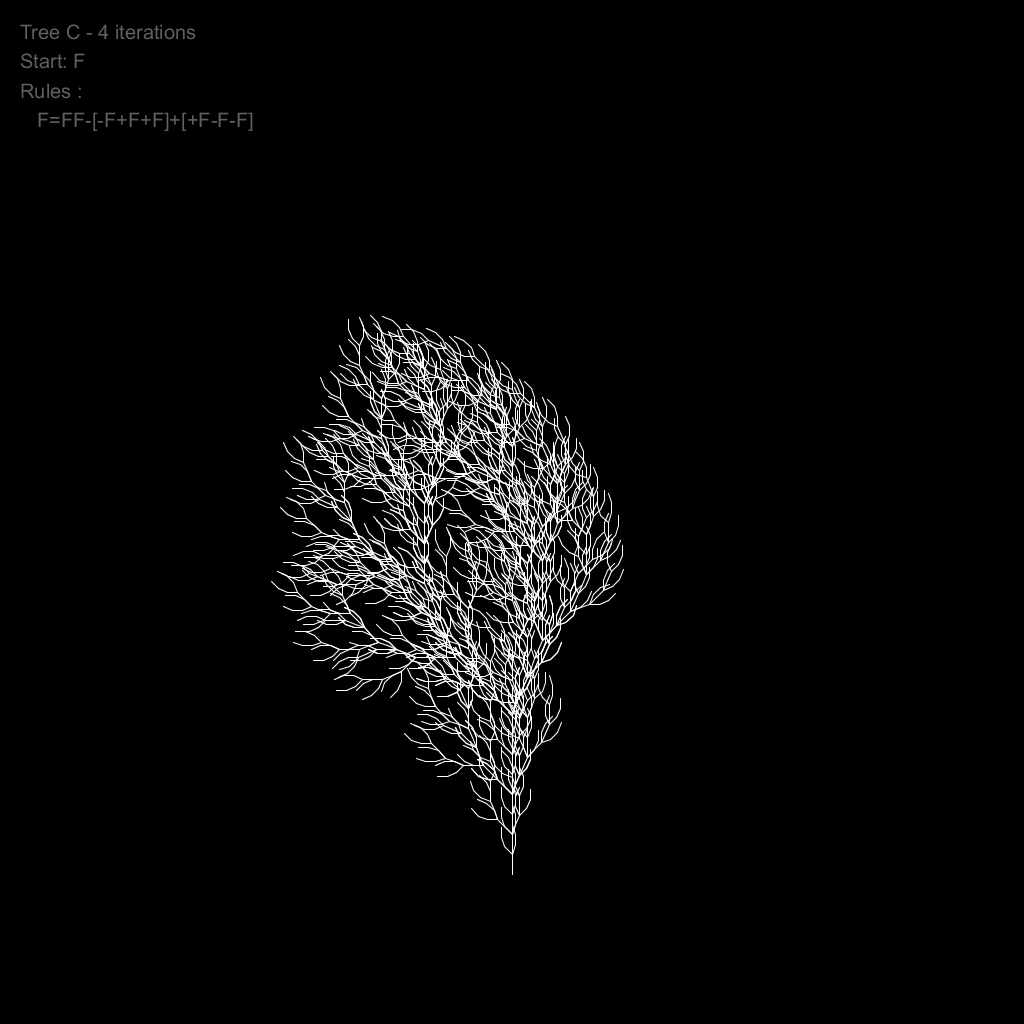
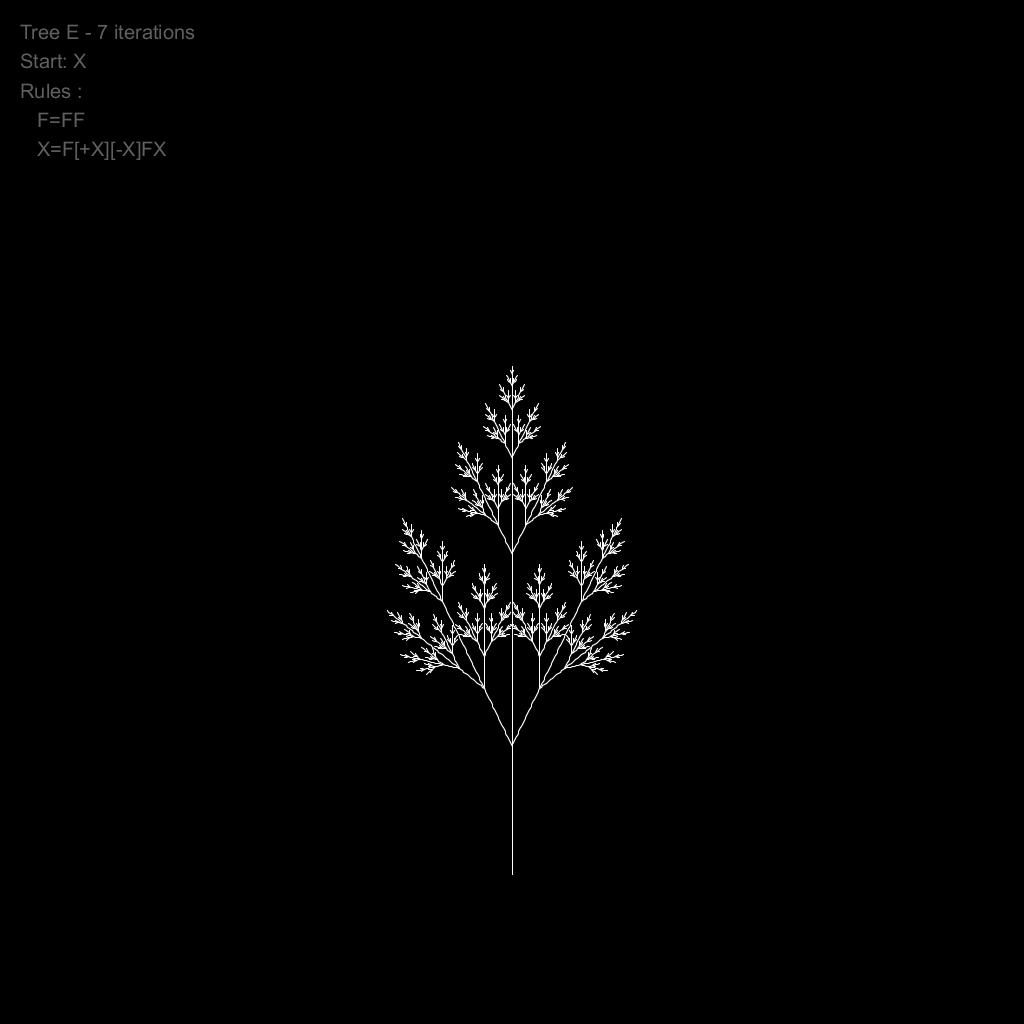
With these very simple types of rules we can generate a swag of different plants:

Tree A

Tree C

Tree D

Tree E

Tree F

Small changes, big impact

One of the nice things about procedural content generation is that a small tweak to the input parameters can result in big changes in the output. The following animation shows the same L-system but with varying iterations, angles and step lengths.

Animated tree

A new dimension

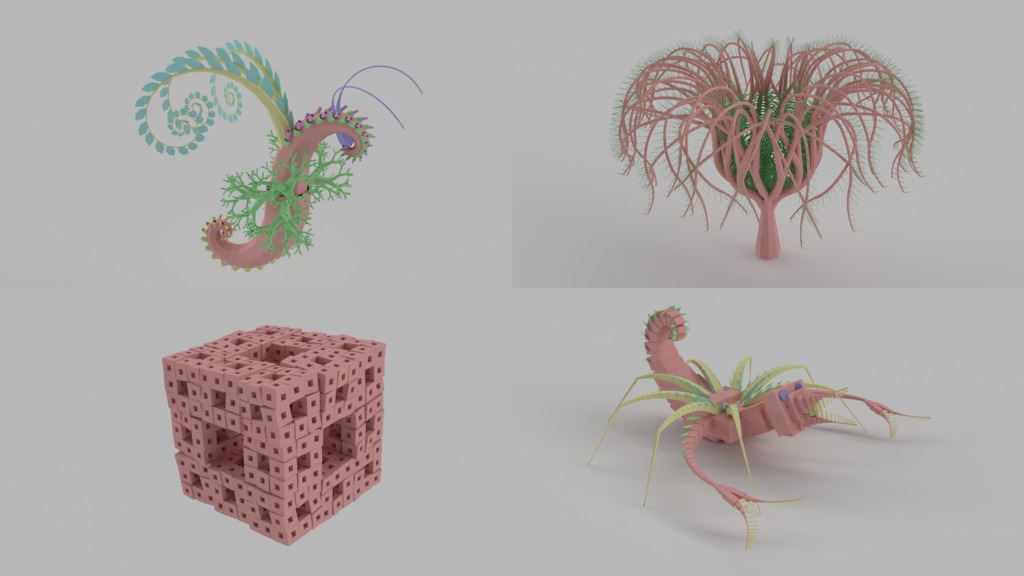
Lastly, our turtle doesn’t necessarily need to only draw only lines or operate in 2 dimensions. Laurens Lapre created a great tool in the early 90’s called LPARSER which generated 3D models using L-systems. Below are a couple of these models rendered in Blender. As you can see in the “spider” and “air horse” examples, organic creatures can also be generated using L-systems. Laurens’ tool also has a mutate function that mutates the generated system to great effect.

3D L-system examples

Wrapping up

Phewww, well that was longer then I expected! If you’d like to find out more about L-systems then check out  The Algorithmic Beauty of Plants by P. Prusinkiewicz and A. Lindenmayer. Also all the code (mostly Processing) used to generate the images above can be found here.

If you enjoyed this post then check out my other posts on procedural content generation.

L is for Logo and wee little turtles

Logo was one of first programming languages (after BASIC) that I really learned in depth. The most famous aspect of Logo is its turtle graphics which simulates a tiny turtle to which you can give commands such as forward, backward, left turn and right turn. As the turtle moves on the screen it draws a line behind it.

With its graphical feedback, turtle graphics is an ideal way to introduce people to programming. Today I thought I’d go over some examples. I’m not going to use Logo but rather the Python programming language which has a turtle graphics module.

First steps, install Python and then launch IDLE (the Python installer should have created a short-cut). Now enter in the following (press Enter at the end of each line):

from turtle import *
showturtle()

You should see window with a black arrow in it. This is the turtle. Now type

forward(100)

The turtle should now move forward 100 turtle steps. Next enter the following lines:

right(90)
forward(100)
left(90)
forward(100)

The right and left commands turn the turtle the number of degrees you specify. It gets a little tedious to type these out the whole time so there is a shorthand. Try these commands:

bk(50)
fd(50)
rt(45)
lt(45)

Ok let’s try something more interesting. We are going to draw a square but first let’s clear the screen:

clearscreen()

Now the square:

fd(100)
rt(90)
fd(100)
rt(90)
fd(100)
rt(90)
fd(100)
rt(90)

Nice. But what if you want to draw lots of squares. It would get very boring typing out all those commands over and over again. Let’s tell the computer how to draw a square (note the indentation of the lines, these are important):

def sq():
    fd(100)
    rt(90)
    fd(100)
    rt(90)
    fd(100)
    rt(90)
    fd(100)
    rt(90)

Now we can just type:

sq()

to draw a square! Try this:

sq()
rt(5)
sq()
rt(5)
sq()

Shiny, we are getting a neat pattern forming… but once again it’s too tedious. So enter this:

clearscreen()
speed(0)
for i in range(6):
    sq()
    rt(60)

The speed command makes the turtle move faster so we don’t have to wait. The for statement gets the computer to repeat a set of commands and the range(6) command creates the numbers 0 to 5, which means that the commands sq() and rt(60) are repeated 6 times. Lets add a fd command in each iteration (step) of the loop:

clearscreen()
speed(0)
for i in range(72):
    sq()
    rt(5)
    fd(20)

And we get a donut type thing. Finally lets go crazy and write a new command called polyspi that calls itself!

def polyspi(angle,inc,side,times):
    if times > 0:
        fd(side)
        rt(angle)
        polyspi(angle,inc, (side + inc),(times - 1))

This is called recursion and because it changes it’s side and times values when it calls itself, we_ _can generate all sorts of interesting patterns such as:

clearscreen()
speed(0)
polyspi(90,5,50,50)

polyspi Example 1

or

clearscreen()
speed(0)
polyspi(95,1,50,100)

polyspi Example 2

or

clearscreen()
speed(0)
polyspi(117,3,25,200)

polyspi Example 3

To find out more check out the Python turtle documentation. Have fun!

AnimfxNZ 2011 – day 1

Just a quick post to cover my first day at Animfx. Apart from some AV glitches everything ran pretty smoothly and all the speakers were fantastic. The MC is hilarious but he didn’t really introduce himself so I have no idea who he is!

The speakers that I saw today were:

Lance Priebe – who gave a good account of Club Penguin and its history. Very interesting.

Patrick Hudson – ex Ensemble Studios who talked about their move from big budget to smaller scale games. Some interesting stuff here but it did sound a bit like “we have just discovered Agile dev” (there was more to it then that of course)

Tracey Sellar – from Microsoft’s usability/user research group discussing their work helping tune AAA titles. The video clip of the usability test session with a guy who obviously wasn’t much of gamer playing a GTA style game was hilarious.

Scott Foe – gave a very good presentation of the state of the game industry and what a studio needs to be doing to be successful.  Interesting push for getting a minimum viable product to market and the using Kanban to create content and updates in a sustainable way.

David Rosenbaum – covering the history of the game industry, the current platforms and the next cycle of platforms and delivery channels.

Sean Kauppinen – threw up lots of facts and figures covering trends in technologies, platforms and markets. Nice interactive session.

And lastly Enrico Casarosa from Pixar who premiered “La Luna” the new Pixar short film. Apparently this was the first time it had been shown in the Southern Hemisphere!  He then proceeded to give a detailed and fascinating account of the development of the short. I only wished that they would have played the short a second time so you could see it in light of all the great background detail that Enrico gave. Here is a YouTube clip from the short:

YouTube Preview Image

All in all very cool day. Tomorrow I’m in the “Games Master Class” which should be fun and on Thursday we get to go hang out at Weta which should be awesome.

Fun with Auckland bus data

A couple of days ago I discovered that Auckland Regional Transport Authority (ARTA) make all of their bus schedule data available for download from the maxx.co.nz site. The data is in the Google Transit Feed format, which means that it consists of a bunch of comma separated value text files, describing things like stops, routes, trips and calendars.

I decided to see what I could do with this data. Below is my first attempt. It is a “density” map of all the bus stops in Auckland.

'Density' map of Auckland bus stops

Click here for a hi-res version that allows you to pan and zoom.

The initial version of the map only took about 30 minutes to create but I have spent a few hours tinkering with it since then.

Quick guide

Here is quick guide to the process if you want to try something like this yourself:

  1. I extracted stops.txt from the data set
  2. I then gpsvisualizer.com to plot out the stops as data points on map. I got it to output a 4096 pixel wide .svg file
  3. Next I used Inkscape to edit the .svg file, adding the text & zoomed area and exporting the result as a  .png file.
  4. Lastly I used the Google Maps Image Cutter to generate the pannable and zoomable version. The Google Maps Image Cutter is a pretty neat tool. It takes any big image, chops it into different resolution tiles and then spits out some html which uses the Google Maps API to view your chopped up image.

Next steps

If I get some more time I will try create some more visualizations. I’m thinking  it would be interesting to merge the bus stop density data with some population data. Also an animation showing 24hrs of bus movement compressed into a couple of minutes would be pretty nice too.

SvnViz 1.0.0 Released

Finally got off my butt and packaged up version 1.0.0 of SvnViz. It can be downloaded from sourceforge.

SvnViz builds visualizations of the activity within a Subversion repository. Here is an example of the default visualization run against the project that I am currently working on. Green dots indicate file adds, blue dots are modified files and red dots are deleted files. The greater the activity of the user the higher their score.

YouTube Preview Image

SvnViz also provides a framework for creating your own visualizations. Simply extend the FrameViz class and implement the generateFrame method. To run your vizualization class, instead of the default class, just pass the fully qualified name of your class to the application using the -vc parameter.

Source files can be downloaded from here. All code is released under the GPL.

Have fun and drop me a line if you come up with an interesting visualization.

I made a light tent

Blue lego block 
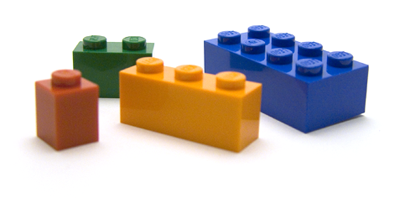
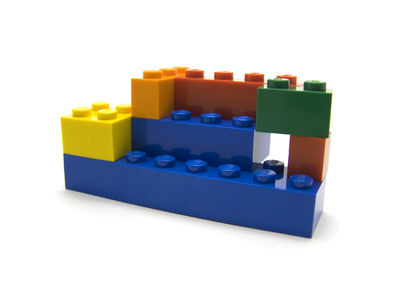
So I wanted to take some close up photos of some Lego blocks (don’t ask) and I wanted them to be on a clean white background like you see in swanky product shots.

After doing some digging around on the web it turns out that what I wanted was a light tent which would allow me to take nicely lit macro shots of items on a “horizon-less” white background.

After some further digging I turned up a number of links on how to build your own light tent which would work just as well as a bought one! This appealed to me since I’m a cheapskate :)

This link: http://digital-photography-school.com/blog/how-to-make-a-inexpensive-light-tent/ seemed to provide the best set of instructions and had some very nice end result pictures. Digging through all the junk in my garage for about 20 minutes turned up all the bits and pieces I needed and after another 30 minutes or so of cutting and gluing, I had my light tent (or more accurately my light box).

The only dampener on the proceedings is that I have skillfully put my mini-tripod somewhere “safe” and I now cannot find it :(

Balancing the lamp on top of the box, I turned on my camera and furiously took pictures of every small item on my desk using my S7000’s macro mode. The images looked great on the camera’s tiny LCD but when transferred to my PC the levels were all wrong and no amount of tinkering with photoshop (with my feeble photoshop-fu) seemed to fix them.

Going back to the web it turns out that I need to set up the white balance for my camera. I did this but still wasn’t getting quite the effect what I was after.  I believe that my problem is that the lamp I am using is not putting out a particularly strong nor white light.

In the end I set my camera to take RAW images and then manipulated the heck out of the images in photoshop to get what I was after. I’m very pleased with the results, here are some pics of the light box and some of the Lego blocks:

Picture of light box

Closeup of light box

Blue lego block

Random blocks

A stack of blocks

Builder

.ICO Plugin for Photoshop

Found this great plug in for Photoshop that lets you open and save Windows Icon files (.ico). It’s from Telegraphics and can be found here along with a bunch of other plug ins.

If you don’t have access to Photoshop then try out GIMP and get the ICO plug in for it from whoop.org.

These tools are great for creating favicons for your websites or to spice up your desktop.